

Who gets the bill?
- Charles Hinckley

- Sep 7, 2022
- 4 min read
Updated: Sep 11, 2022
There are too many myths and false narratives circulating about the current energy situation …Markus Krebber, CEO, RWE[1]

Figure 1: MISO Indiana Hub ATC DA forward month price SEAG, source Bloomberg
Introduction
Ratepayers – and the bill is enormous, growing and not likely to go down anytime soon.
There is more going on in the US power markets today than at any other time since power markets were deregulated in the early 1990’s. Let’s use the State of Indiana as a sample of the larger US market taken as a whole.
For the State of Indiana alone over $4 billion is the increase value of the 2022 power market vs. the 2021 power market, meaning the total value of the power market was 2.5 x higher in 2022 than in 2021 for the State of Indiana. In many cases, these liabilities are being incurred on behalf of ratepayers and have yet to make it to retail power bills and mailboxes.
The tremendous positive impact that wind and solar power projects have on reducing wholesale power prices is becoming undeniably visible across several markets. The solutions to moderating US power prices are shockingly clear – and not very painful. We need more power plants online ASAP. Wind, solar, gas fired, “all of the above” have important roles to replace the old, retiring, and expensive to operate coal power plant fleet. There are serious constraints in the way of building this needed capacity. The failure to remove these constraints will cost the US economy dearly.
Today in the Midwestern Independent System Operator (“MISO”) territory of which most of Indiana is a part, there is one 500 MW gas fired unit under construction, and three others totaling 3,500 MW in development[1]. Realize that it takes 5 plus years to develop and build a combined cycle gas fired power plant, and over 10 years for coal. It takes 2 to 3 years to develop and build a solar power plant. Over 11,000 MW of coal has been retired since 2017[2]. Increasing natural gas powered generation is important, but very constrained by the limited number of gas fired power plants in development – four for all of MISO, which is a drop in the bucket.
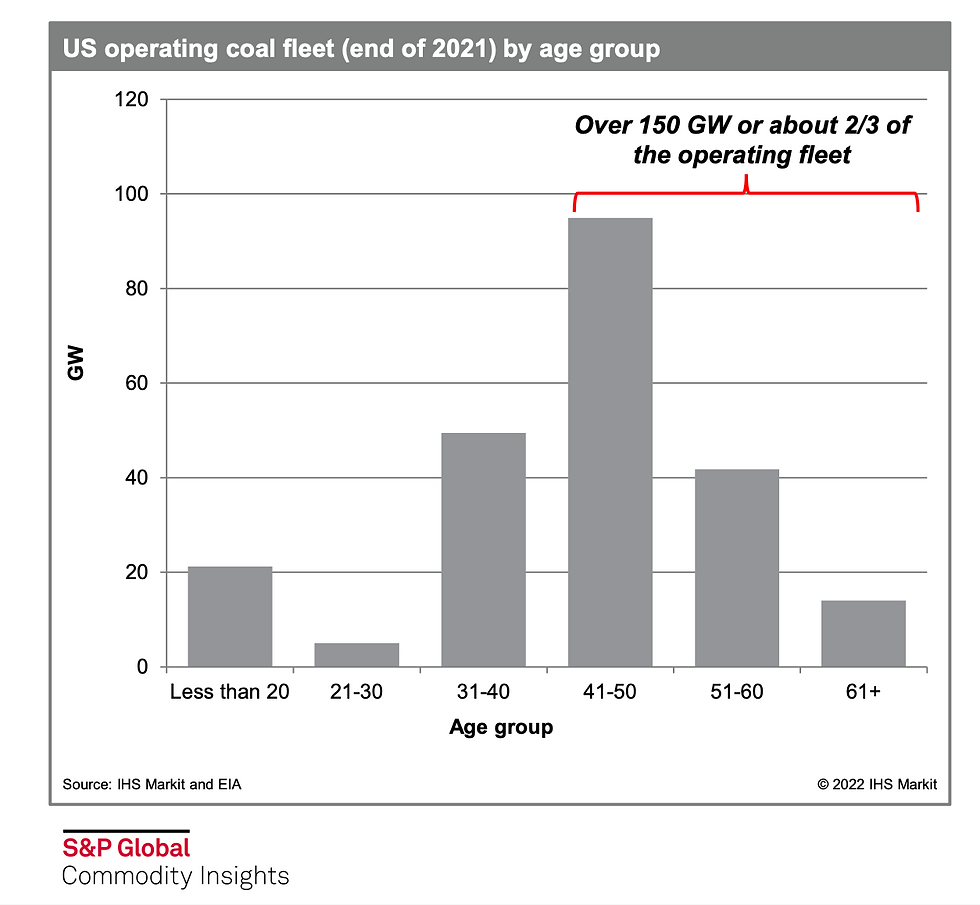
And coal retirements will continue: the age of the US coal fleet exceeds its useful life.
.
Figure 2: Age of US Coal generation fleet, Source: S&P
Some Statistics about the Indy Hub power market
Examining Indy Around the Clock trailing twelve months (TTM) next month power prices for each of the past five twelve-month periods, we find that 2022 Indy Hub power prices were approximately 2.5 x the same period 2021 prices.
All those lines hovering around $25/MW in Figure 1 are various twelve-month periods over the past five years. Around July 2021, Indy Hub power market pricing started decoupling from the historical average market price level, which had been very stable for a long period. By early 2022, prices started settling in at a new price regime centering around $60/MWHR – approximately 2 + times historical power pricing.
Market power prices were for the TTM (September 3, 2021 to September 2, 2022) period (the “2022 period”): $74.79. For the prior twelve-month period (the ”2021 period”): $29.56, an increase of $45. We let the TTM period ending 2 September 2022 which is the date the data was accessed.
For the trailing six-month period, these numbers were: T6M n: $92.29, $23.28, for a difference of $69.01. That is, things are getting worse, not better.
All prices are the first month forward price for around the clock power. Not all power is purchased in this manner, of course. Nevertheless, this method is representative of the market taken as a whole.
Some Math
The total MWHRs sold in Indiana in the 2021 calendar year was 88,019,989 MWHrs. We are using this as our baseline reference for total market volume. The total size of the 2021 power market was approximately $2.6 Billion, and the total size of the 2022 market was approximately $6.6 Billion, for a difference of $4.0 Billion / 2.5 times.
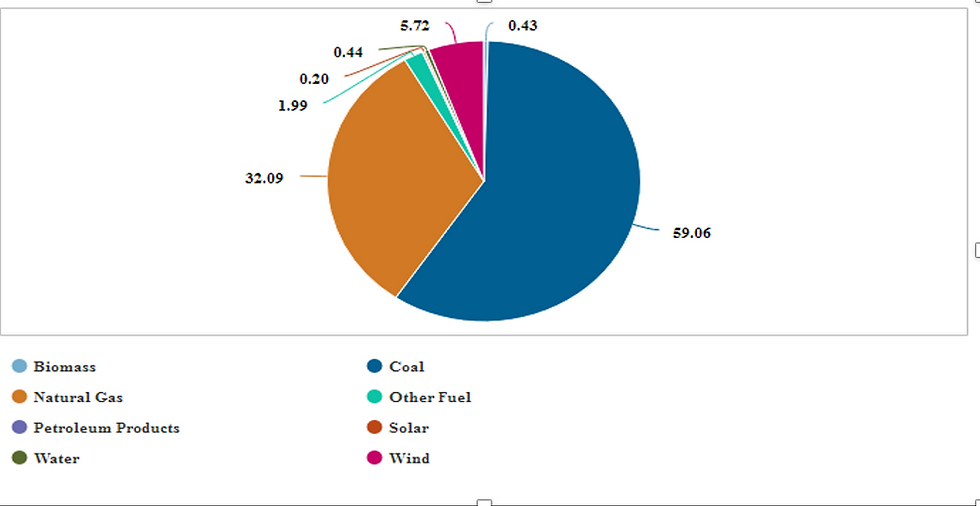
Figure 3: Capacity and Generation Summary for State of Indiana 2021, Source: S&P Capital IQ accessed September 2, 2022[3]
The Forwards
The following is a chart of the Indiana Hub ATC power next month’s power forward price for the next ten years for two periods – today is the yellow curve and the same forward strip for the year prior period the green curve. Power is a lot more expensive to buy forward today than it was a year ago.
So, the forward markets do not believe that this new 2022 pricing regime will change in the foreseeable future.
It is important to understand that the price power trades today for say, a month 5 years from today is NOT the expected price for the power during that forward period. Rather, this is the price buyers and sellers are willing to buy and sell that forward power period today – with the seller such as a power plant wanting to cover its long position, and a buyer offering the liquidity today and needing to cover the cost of capital plus a return on this bet.
Commodity markets globally are severely liquidity constrained – traders have less value at risk to play with due to the state of global markets generally.

Figure 4: Indiana Hub ATC first month power, source Bloomberg
There is only one way to look at the current price of power, or any commodity; it is the price. The market has spoken, and the trades are the price the market trades at given the current conditions. Other than the past, and the current conditions, nothing else is known – it’s the future. If one takes the price history for Indy Hub power and askes various mathematical models “what is the likelihood that the future trades back to $35 in the next two years?”, the answer is less than 1%. Therefore, the forwards trade at a price that create a minimum Value At Risk for traders willing to take that bet today.
A Few Observations
Total wind and solar generation for the State of Indiana in 2021: 5.2 MM MWHRs or 5.9% of the total generation in 2021. No, this was not the cause of the increase in power prices in 2022 for several reasons. The causes were first US coal price, second Putin and US natural gas price and third retiring aging US coal power plants.
How to make things better: simple, the US needs more wind, solar and gas fired power units.
More on these subjects to come.


Comments